Stat-Ease Blog

Categories
Ask An Expert: Len Rubinstein
Next in our 40th anniversary “Ask an Expert” blog series is Leonard “Len” Rubinstein, a Distinguished Scientist at Merck. He has over 3 decades of experience in the pharmaceutical industry, with a background in immunology. Len has spent the last couple of decades working on bioanalytical development, supporting bioprocess and clinical assay endpoints. He’s also a decades-long proponent of design of experiments (DOE), so we reached out to learn what he has to say!
When did you first learn about DOE? What convinced you to try it?
I first learned about DOE in 1996. I enrolled in a six-day training course to better understand the benefits of this approach in my assay development.
What convinced you to stick with DOE, rather than going back to one-factor-at-a-time (OFAT) designs?
Once I started using the DOE approach, I was able to shorten development time but, more importantly, gained insights into understanding interactions and modeling the results to predict optimal parameters that provided the most robust and least variable bioanalytical methods. Afterward, I could never go back to OFAT!
How do you currently use & promote DOE at your company?
DOE has been used in many areas across the company for years, but it has not been explicitly used for the analytical methods supporting clinical studies. I raised awareness through presentations and some brief training sessions. Afterward, after my management adopted it, I started sponsoring the training. Since 2018, I have sponsored four in-person training sessions, each with 20 participants.
Some examples of where we used DOE can be found at the end of this interview.
What’s been your approach for spreading the word about how beneficial DOE is?
Convincing others to use DOE is about allowing them to experience the benefits and see how it’s more productive than using an OFAT approach. They get a better understanding of the boundaries of the levels of their factors to have little effect on the result and, more importantly, sometimes discard what they thought was an important factor(s) in favor of those that truly influenced their desired outcome.
Is there anything else you’d like to share to further the cause of DOE?
It would be beneficial if our scientists were exposed to DOE approaches in secondary education, be it a BA/BS, MA/MS, or PhD program. Having an introduction better prepares those who go on to develop the foundation and a desire to continue using the DOE approach and honing their skills with this type of statistical design in their method development.
And there you have it! We appreciate Len’s perspective and hope you’re able to follow in his footsteps for experimental success. If you’re a secondary education teacher and want to take Len’s advice about introducing DOE to your students, send us a note: we have “course-in-a-box” options for qualified instructors, and we offer discounts to all academics who want to use Stat-Ease software or learn DOE from us.
Len’s published research:
Whiteman, M.C., Bogardus, L., Giacone, D.G., Rubinstein, L.J., Antonello, J.M., Sun, D., Daijogo, S. and K.B. Gurney. 2018. Virus reduction neutralization test: A single-cell imaging high-throughput virus neutralization assay for Dengue. American Journal of Tropical Medicine and Hygiene. 99(6):1430-1439.
Sun, D., Hsu, A., Bogardus, L., Rubinstein, L.J., Antonello, J.M., Gurney, K.B., Whiteman, M.C. and S. Dellatore. 2021. Development and qualification of a fast, high-throughput and robust imaging-based neutralization assay for respiratory syncytial virus. Journal of Immunological Methods. 494:113054
Marchese, R.D., Puchalski, D., Miller, P., Antonello, J., Hammond, O., Green, T., Rubinstein, L.J., Caulfield, M.J. and D. Sikkema. 2009. Optimization and validation of a multiplex, electrochemiluminescence-based detection assay for the quantitation of immunoglobulin G serotype-specific anti-pneumococcal antibodies in human serum. Clinical and Vaccine Immunology. 16(3):387-396.
Understanding Lack of Fit: When to Worry
An analysis of variance (ANOVA) is often accompanied by a model-validation statistic called a lack of fit (LOF) test. A statistically significant LOF test often worries experimenters because it indicates that the model does not fit the data well. This article will provide experimenters a better understanding of this statistic and what could cause it to be significant.
The LOF formula is:
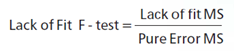
where MS = Mean Square. The numerator (“Lack of fit”) in this equation is the variation between the actual measurements and the values predicted by the model. The denominator (“Pure Error”) is the variation among any replicates. The variation between the replicates should be an estimate of the normal process variation of the system. Significant lack of fit means that the variation of the design points about their predicted values is much larger than the variation of the replicates about their mean values. Either the model doesn't predict well, or the runs replicate so well that their variance is small, or some combination of the two.
Case 1: The model doesn’t predict well
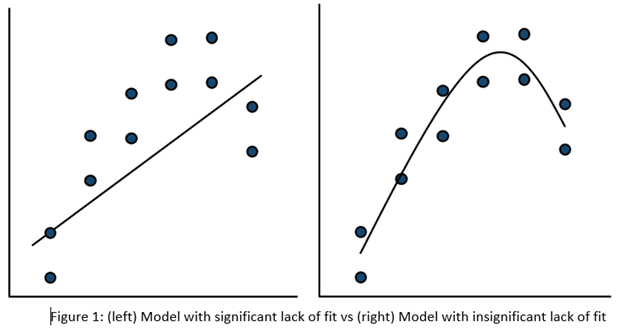
On the left side of Figure 1, a linear model is fit to the given set of points. Since the variation between the actual data and the fitted model is very large, this is likely going to result in a significant LOF test. The linear model is not a good fit to this set of data. On the right side, a quadratic model is now fit to the points and is likely to result in a non-significant LOF test. One potential solution to a significant lack of fit test is to fit a higher-order model.
Case 2: The replicates have unusually low variability
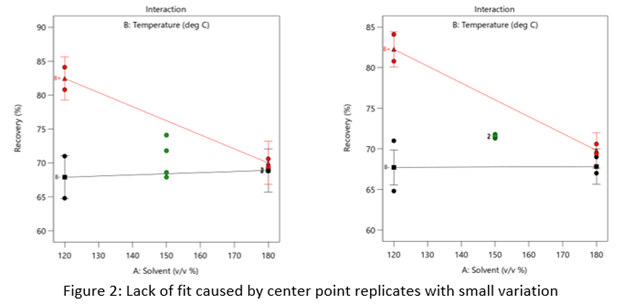
Figure 2 (left) is an illustration of a data set that had a statistically significant factorial model, including some center points with variation that is similar to the variation between other design points and their predictions. Figure 2 (right) is the same data set with the center points having extremely small variation. They are so close together that they overlap. Although the predicted factorial model fits the model points well (providing the significant model fit), the differences between the actual data points are substantially greater than the differences between the center points. This is what triggers the significant LOF statistic. The center points are fitting better than the model points. Does this significant LOF require us to declare the model unusable? That remains to be seen as discussed below.
When there is significant lack of fit, check how the replicates were run— were they independent process conditions run from scratch, or were they simply replicated measurements on a single setup of that condition? Replicates that come from independent setups of the process are likely to contain more of the natural process variation. Look at the response measurements from the replicates and ask yourself if this amount of variation is similar to what you would normally expect from the process. If the “replicates" were run more like repeated measurements, it is likely that the pure error has been underestimated (making the LOF denominator artificially small). In this case, the lack of fit statistic is no longer a valid test and decisions about using the model will have to be made based on other statistical criteria.
If the replicates have been run correctly, then the significant LOF indicates that perhaps the model is not fitting all the design points well. Consider transformations (check the Box Cox diagnostic plot). Check for outliers. It may be that a higher-order model would fit the data better. In that case, the design probably needs to be augmented with more runs to estimate the additional terms.
If nothing can be done to improve the fit of the model, it may be necessary to use the model as is and then rely on confirmation runs to validate the experimental results. In this case, be alert to the possibility that the model may not be a very good predictor of the process in specific areas of the design space.