One-Factor Categoric (pt 2)
Part 2 - Advanced Features
Note
Screenshots may differ slightly depending on software version.
Digging Deeper Into Diagnostics
If your bowling data is active in Stat-Ease® software from Part 1 of this tutorial, continue on. Otherwise, load the Bowling data by clicking on the Help > Tutorial Data > Bowling file. Then, under the Analysis branch click the Score node, Start Analysis (if not already done), and press the Diagnostics tab.
We’re now going to look at a new graph in the Diagnostics Tool. In the layout toolbar, select the single split icon to maximize the current plot.

Now select the DFFITS tab.

DFFITS tab
This statistic, which stands for difference in fits, measures the change in each predicted value that occurs when that response is deleted. The larger the absolute value of DFFITS, the more it influences the fitted model. (For more details on this statistic and the related deletion diagnostic, DFBETAS, see our program Help or refer to Raymond Myers’ Classical and Modern Regression with Applications, 2nd Edition (Duxbury, 2000).)

DFFITS graph (your graph may differ due to random runs)
Notice that one point lies above the rest. (The pattern on your graph may differ from what we show here due to randomized run order, but this isn’t a concern in this discussion.) The top-most point is Mark’s high game, which earlier created controversy, particularly among competitors Pat and Shari. Mark’s point falls below the benchmark of plus-or-minus 1.22 for the DFFITS. So, taking all other diagnostics into consideration, we don’t advise that this particular run be investigated further. Nevertheless, for purposes of learning how to use new software features, right-click Mark’s top point with your mouse and select Highlight Point as shown below.

Highlighting a point
Myers demonstrates mathematically that the DFFITS statistic is really the externally studentized residual multiplied by high leverage points. Select the Leverage tab and you’ll see that all runs exhibit equal leverage here because an equal number of runs were made at each treatment level (all three bowlers rolled six games each).

Leverages
Therefore, this DFFITS exhibits a pattern identical to that shown on the externally studentized residual graph, which you studied in the preceding tutorial. The reason we’re reviewing this is to set the stage for what you’ll do later in this tutorial – unbalance the leverages to make this session more significant for diagnostic purposes.
Here’s one final feature for you before we leave the Diagnostics. Select the Report tab to get a table of statistics case-by-case in standard order for the entire experiment. For those of you who prefer numbers over pictures (statisticians for sure!), this should satisfy your appetite. Notice that Mark’s high 195 game is highlighted in blue text as shown below. That’s because we highlighted it on the graphs. If there were outliers or other out of bounds runs, they would be colored on the graph, too.

Report with case statistics used for preceding diagnostics graphs
Remember, you can right-click any value in reports of this nature within the software to view context-sensitive Help with statistical details.
Modifying the Design Layout
Stat-Ease offers great flexibility when modifying data in its design layout. We’ll see in this bowling scenario how our software allows you to modify an existing design with added blocks and factor levels.
The outcome of the bowling match appears to be definitive, especially from Mark’s perspective. But Pat and Shari demand one more chance to prove themselves worthy of the team. They still think Mark’s high 195 game was a fluke, even though this isn’t supported by the diagnostic analysis. Mark objects and a dispute ensues.
Attempting compromise, the team captain decides to toss out the highest and lowest games for each of the three bowlers and replace them with two new scores each. But Ben, a newly hired programmer and avid bowler, arrives at the alley and is allowed to participate in this second block of runs. (Yes, this makes little sense, but it will add some interest to this tour of Stat-Ease’s flexibility for design and analysis of experiments – no matter how convoluted they become in actuality.)
It quickly becomes apparent that this new kid does things differently. He’s a lefty with a huge hook that’s hard to control. To aggravate this variability, Ben does something very different from other bowlers – he does not put his thumb in the ball’s hole made for that purpose. When Ben’s odd approach works, the pins go flying. But as likely as not, that ball slides off into the left gutter or careens over the edge on the right.
The results for Ben and the three original bowling team candidates are below.

Bowling scores with high and low games replaced by two new games (plus a new guy)
To enter this new data (and ignore some of the old), click the Design node in the navigation pane (left sidebar). You should now see the bowling data from the first tutorial. Mark’s high 195 game remains highlighted in blue text (assuming you clicked on it as instructed while performing the diagnostics).
Right click the top-left column header and click Block. This design attribute is now needed to accommodate the new bowler’s (Ben’s) incoming score data.

Selecting block to display it as column in the design layout
Right click the Response column header and choose Sort Ascending.
Mark’s best game now drops to the very bottom. Let’s single him out first to placate Pat and Shari. Right-click the square button at the left of the last row (Mark’s 195 score). Click Set Row Status, then Ignore as shown below.

Ignoring Mark’s high game
By the way, it’s OK to change your mind when modifying your design layout: You can ‘un-ignore’ a row by clicking Set Row Status, Normal.
Now let’s really get Pat’s and Shari’s hopes high by excluding their low games from consideration. Click the square button (in the Select column) to the left of the top row (Pat’s low 140 game) and, while pressing down the Shift key, also click the button in the Select column’s second row (Shari’s low 145 game). Release the Shift key. Keep your mouse within the Select column’s first or second row, right-click and choose Set Row Status, Ignore for these two low games, as shown below.

Ignoring the low games for Pat and Shari
Now move down a few rows and click the square button in the Select column’s row showing Mark’s low 165 game.
Notice the two rows below Mark’s low 165 game – the high games for Shari (166) and Pat (167). It’s now time for Shari and Pat to pay the price for complaining. While first pressing and holding down the Shift key, click the following two square buttons in the Select column’s row: Shari’s high 166 game and Pat’s high 167 game. Release the Shift key. Three rows should now be highlighted in light blue as shown below. Keep your mouse within the Select column’s highlighted three rows, right-click and choose Set Row Status, Ignore.

Ignoring Mark’s low game and the high games for Shari and Pat
Now let’s restore the original layout order. Right-click the Factor 1 (A: Bowler) column header, then choose Sort Ascending. Compare your screen with what we show below. If there are differences, fix them now to match this screenshot. However, remember that the run number is random, so you don’t need to fix that.

Back to standard order after low and high games ignored for each bowler
Now create a new block (needed for the second round of bowling) by clicking the “Block” column header. You will then see in the Design Properties pane (on the left side of the screen) a Block section. Select Levels. This enables an ellipsis icon […] button for editing block information. Click it.

Creating a new block
You’ll see a form allowing you to assign names to the block(s). Don’t bother doing this now. As shown below, change Number of Blocks to 2.

Adding a second block of runs
Click OK. It seems that nothing changed, but actually the program now knows that you will be conducting another block of runs.
Now you are ready to begin adding and/or duplicating rows. This can be accomplished in different ways, depending on your ingenuity. We’ll follow routes revealing as many of the editing features as possible, although they may not demonstrate the most elegant approaches. As shown below, right click the Select column’s square button at the left of the first row (Pat’s 140 game) to bring up the editing menu. Then choose, Insert Row->Before This Row.

Inserting a new row
You now see a new row containing blanks for the bowler and the score. (Don’t worry if it’s being ignored – crossed out, that is – for the moment.) Click the first row’s block cell directly below the block field header, then click the list arrow.
Select Block 2 as shown below.

Changing the block number
Click the blank field for bowler and press the list arrow. Select Pat. (We’re using categorical factors here, but if this were a numerical field, you’d enter a value.)

Entering a categorical value for factor
Again, right-click the Select column’s square button at the left of the first row to bring up the editing menu as shown below. Click Duplicate.

Duplicating a row
The program may pop up a warning like the one shown below.

Warning about categoric contrasts
The program is recognizing a potential problem here and is alerting you that only one bowler is in the second block. You need not worry at this stage because you will be adding others. Click the check option Do not show this warning again. Don’t worry – you will not be unprotected indefinitely. This warning will be re-enabled the next time you start the program.

Turning off a warning (it will come back the next time you run the program)
Press OK to proceed.
Right-click the Block column header and choose Sort Ascending.
Two new rows are now seen at the bottom of your design layout. We need two new rows apiece for Shari and Mark. Let’s simply duplicate Pat’s two new rows and update the names. Do this by first clicking the Select column’s square button at the left of Pat’s first new row, so it is highlighted. Then while holding down the Shift key, click the Select column’s square button at the left of Pat’s second new row. Both rows should now be highlighted.
Now right-click any Select column’s square button at the left of the highlighted block and select Duplicate. (If the warning screen pops up again, click OK.)

Duplicating a block of rows
In the first duplicated row, click the field for Bowler and select Mark.

Changing name of bowler
Do the same for the last row. You now should have two new rows for both Pat and Mark. Click the Select column’s square button at the left of Mark’s first new row, so it is highlighted. Then while holding down the Shift key, click the Select column’s square button at the left of Mark’s second new row. Both rows should now be highlighted. As before, right-click any Select column’s square button at the left of the highlighted block and select Duplicate.

Duplicating two more rows
In the first duplicated row, click the field for Bowler and select Shari. Do the same for the last row.

Completing lineup for block 2 - the second round of bowling
But what about the new guy – Ben? We need to identify him as a new competitor in this bowling contest. Do this by clicking the header for Factor 1, then selecting Levels (under Categoric Factor in the Design Properties pane), and clicking the ellipsis […] to the right.
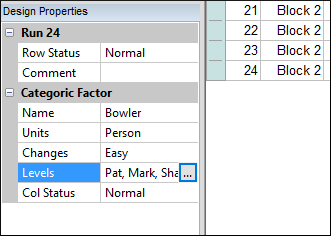
Getting ready to add a new level for the factor
Change Number of Levels to 4 (see below), then click in the Name field for level 4 and enter Ben.

Changing number of levels and adding another bowler
Press OK, then OK again when presented with a warning. Now duplicate two more rows by clicking the Select column’s square button at the left of the first of Shari’s two new games at the bottom of the list. While holding down the Shift key, click the Select column’s square button at the left of the last run (Control click to select multiple, non-consecutive rows). Finally, right-click any Select column’s square button at the left of the highlighted block and select Duplicate.
In both of these new duplicated rows, click the fields for Bowler and select Ben (click OK when presented with another warning).

Ben now on the list as a bowler
Note
An important aside: Always randomize your run orders for actual experiments. For purposes of this tutorial, this will just be a bother, so do this only if you wish to try it out, but it’s very easy to do – simply right-click the Run column-header and do this for Block 2 as shown.

How to randomize the run order in the second block
To make it easier to enter the results, double-click the Factor 1 (A: Bowler) column header to sort it ascending. Then double-click the Block column header to sort it ascending. Now enter the eight new scores as shown below.

Data entered for second block of games
Go ahead now and re-analyze your data by clicking the Score node under Analysis. Press Start Analysis.
Click the square appearing at the end of the green triangles (error estimates) on the half-normal plot of effects. This puts A-Bowler in your model.
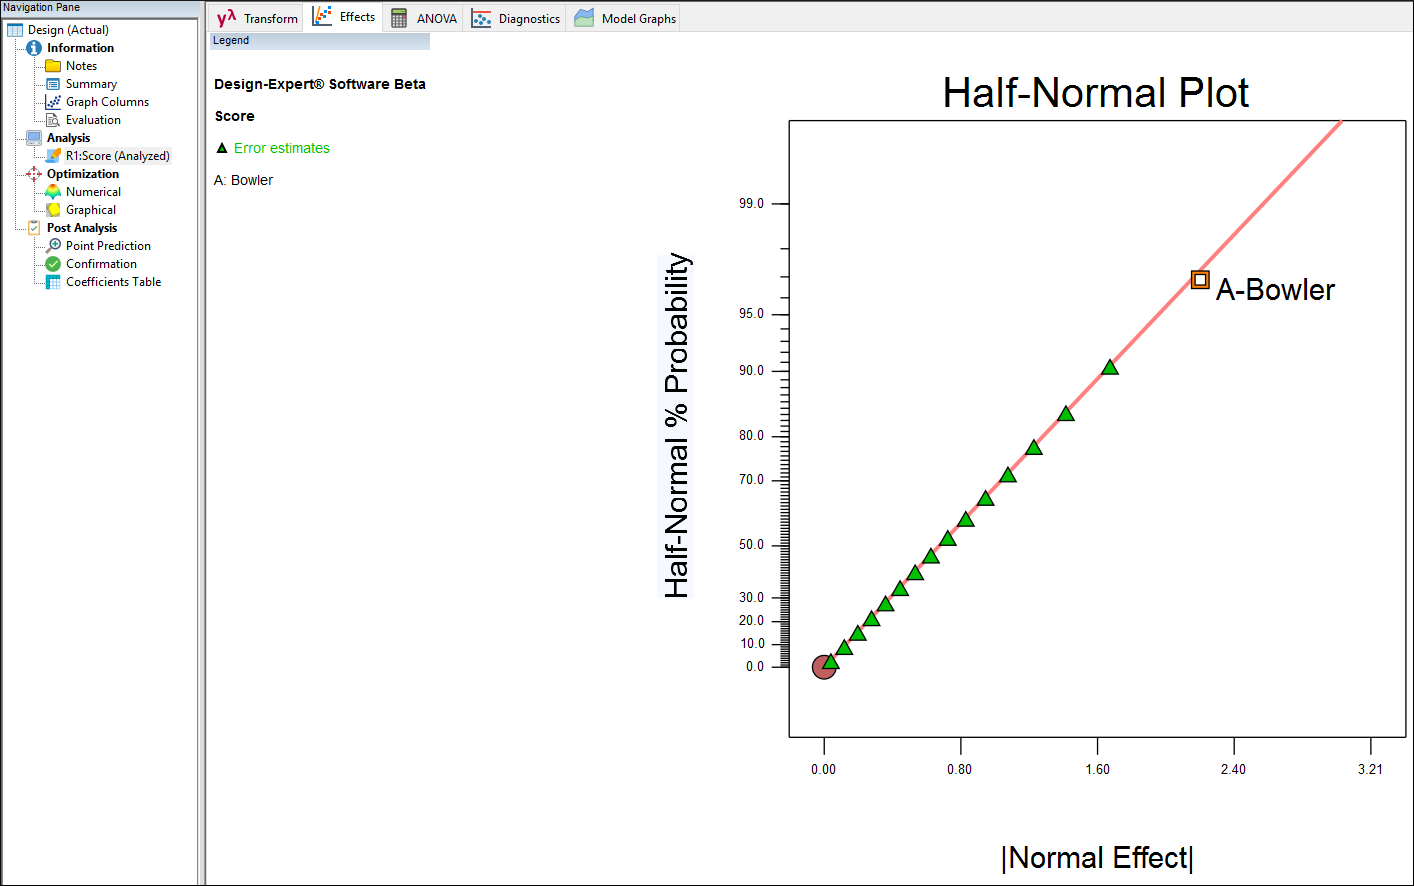
Bowler pick on half-normal plot of effects
Proceed to ANOVA (overlooking this model being not significant) and then to Diagnostics. Now go to the Normal Plot. As you will see, something is abnormal about this data. Do you notice that the residuals now line up very poorly, especially at the extreme points as shown below? On the floating Diagnostics Tool change Color by to A: Bowler.

Diagnostics for bowling results – part two: Normal plot with poorly aligned residuals
Now (referring to the color key at the left of the plot) you see that the results from Ben do not fit with the others (his games are the two outliers – low and high). Considering his odd, unstable style of bowling, this should be no surprise. Click the Resid. vs Run button to bring up the externally studentized residuals – a good tool for detecting outliers. Drag your mouse over Ben’s residuals (if you have to, rope them each individually).

Ben’s games highlighted for being outliers (your screen may differ due to randomized run order)
Both points should now be highlighted. We must ignore or delete them. (Sorry Ben, odd behavior by programmers is considered normal at Stat-Ease, but not when it comes to bowling!)
Click the Design node (upper left) to get back to the home base of the design layout. Notice that Ben’s games are conveniently highlighted in blue text so they can easily be deleted.
Note
Ignoring data: It provides no advantage in this case, which features only one response measure, but you can ignore a specific result by right-clicking that cell and setting Set Cell Status to Ignore as shown below.

Ignoring a single cell – an option that’s not recommended for this case
In this case you could ignore his entire runs (we explained how to do this earlier). Better yet, simply delete them altogether. No offense to Ben, but given that he only bowled two games and his unorthodox style creates such abnormal variability, it is best now to click the Select column’s square button at the left of his first score of 200 (making him feel really bad), shift-click the button below it for the second game of 130 (not so sorry to see this gone!), then without moving your mouse, right-click and select Delete Row(s).

Deleting Ben’s games
Click OK on the error message that pops up about categoric contrasts (a safety precaution). Then go ahead and re-analyze the results.
It turns out that the added games cause no change in the overall conclusions as to who’s the better bowler. Mark remains on top. It would now be appropriate to recover the low and high games for each bowler from block 1. Because this data was not deleted, only ignored, getting it back is simply a matter of right-clicking to the left of each of the six suspect rows and changing Set Row Status to Normal. (Or, if you’re adept at manipulating lines of text or data with your mouse, do all rows at once using a click and shift-click.) Give this a try! Then re-analyze one last time.
By working through this exercise, you now see how easy it is to manipulate Stat-Ease’s design layout.
P.S. Still feeling bad about deleting Ben’s scores? Don’t worry – he gets to bowl with Pat and Shari in a lesser league. After bowling for an entire year (roughly 100 games), it will become clear whether Ben’s crazy way of bowling will pay off by achieving a good average overall. After all, his 2 game average of 165 wasn’t so bad, just inconsistent (high variability). With more data, his true ability will become more apparent.
