Note
Screenshots may differ slightly depending on software version.
RSM with Categoric Factors
Combining categoric with numeric factors
Procter and Gamble (P&G) engineers working on a new sealing process became concerned about how maximum peel strength would be affected by changing suppliers of packaging material (Brenneman, William A., and William R. Myers, “Robust Parameter Design with Categorical Noise Variables,” Journal of Quality Technology 35, no. 4 (October 2003): 335-341). They set up an RSM design to vary several key factors on the sealing machine, including the supplier:
Temperature, 193 to 230 degrees C.
Pressure, 2.2 to 3.2 Bar.
Speed, 32 to 50 cpm (cycles per minute).
Supplier: S1, S2, S3.
Due to limitations of time and other resources, a maximum of 37 runs can be performed. Therefore, simply conducting a standard central composite design (CCD) or Box-Behnken design (BBD) for each of the three suppliers will not do – these design choices produce far too many runs (60 and 51, respectively). Instead, P&G engineers use an optimal design.
The data below come from a simulation loosely based on the predictive model reported in the cited article. (For tutorial purposes, some liberties are taken to make the procedural outcome more challenging.) Assume the maximum peel strength ideally hits a target of 4.5 pound-force (lbf). However, it must exceed 3 lbf to prevent leaking and not exceed 6 lbf because the package becomes too difficult to open.
This tutorial explains how a design is constructed via optimal criteria with added points for lack of fit testing and pure-error estimation. Notice we use nearly all budgeted runs. Also, aided by a feature in the software that forces balance, we make sure each supplier receives an equal number of design runs.
With guidance from the tutorial you analyze responses and then find desirable solutions meeting the following objectives – listed according to relative acceptability for all concerned:
Can the process be adjusted to attain a maximum peel strength target of 4.5 lbs for any one supplier?
The purchasing agent intends to break down suppliers as follows: 50% to S1, 25% to S2, and 25% to S3. Can you find a process setup that works for all suppliers? If not, a two-supplier option might be satisfactory, provided S1 is one of them. In other words, assuming the process is not robust for all three suppliers, can the process be set up in a manner that either S1-S2 or S1-S3 meets specifications?
If it is not possible to achieve a common process for even two of the three suppliers, perhaps the upper limit of 6 can be raised on the maximum peel strength specification. (Assume customers are willing to use scissors or, better yet, package designers notch the plastic for easier opening.) Does this open a window of operability for multiple suppliers at one set of process conditions?
Here is the simulation data loosely based on the above cited article:

Data based on package sealing experiment
Design the Experiment
Start Stat-Ease® and initiate your design process by clicking the
blank-sheet icon ![]() on the left of the toolbar, or select File, New Design,
or simply click New Design on our opening screen.
on the left of the toolbar, or select File, New Design,
or simply click New Design on our opening screen.
Click Response Surface on the left, select Optimal (custom) as your design. For Numeric Factors choose 3. For Categoric Factors choose 1. Type in (and tab over) Name, Units, L[1] (lower limit) and L[2] (upper limit) for numeric factors A, B, and C as shown below. For categoric factor D, type in (and tab over) Name, Units, Levels (3), and L[1], L[2], L[3].

Entering numeric and categoric factor levels for optimal design
In the above screen shot, the Type column automatically selects via default either “Nominal” or “Continuous.” “Nominal” applies to categoric factor D because its treatments are discrete names (S1, S2, S3). When entering ordered treatments (1, 2, 3, for example), it is best to set these up with “Ordinal” contrasts – available as a droplist option – because subsequent model construction and ANOVA layout are then properly applied.
Press Next. Notice the “Search” dropdown menu defaults to “Best” and “Optimality” defaults to “I”.

Default selections for optimal design
To create more convenient levels in the numerical factors, change the Search to Point exchange.

Changing search to point exchange
Change the Optimality to D, as used by the P&G engineers. For more statistical details on Stat-Ease’s optimal model selection screen press the screen tips icon (the light bulb) or select Help, Screen Tips off the main menu.
At this stage the runs total to 28, which is not divisible by 3 – desirable for splitting evenly among your three suppliers. To compensate for this, bulk up your design to 36 runs (12 to each supplier) by increasing Lack-of-fit points to 9. Tab to Replicates and again enter 9. Set a check-mark at Force categoric balance. Not doing this could result in a design with more of one supplier than another, which would doubtless generate questions from the purchasing department because it would seem unfair. A warning alerts you that forcing categoric balance might require adjustments.

Forcing categoric balance might require adjustments
Press OK to continue.

Changing to D optimality and making other changes
Now press Edit candidate points so you can see which combinations the program starts with, from which only an optimal subset will be chosen. A pop-up screen appears. Press Calculate points to see if the point selection produces more than the minimum needed to fit the selected model.

Optimal specifications modified
The program now identifies 53 candidate points for each of the 3 suppliers for a total of 159, from which it will select optimally 18 points needed at a minimum for the quadratic model. The program will add 9 more runs with unique factor combinations to test lack of fit. Finally, 9 of the 27 points already identified will be replicated.
Press OK, then press Next. Enter response Name and Units as shown below.

Response names and units – name field expanded horizontally
Press Finish. A warning may alert you the program is preserving a balanced design for you, which causes a slight loss in optimality.
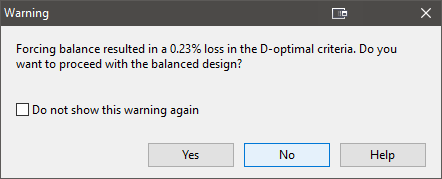
Forced-balancing warning about a slight loss in optimality
Your loss percentage may differ from that shown below, but in any case it will be negligible. If the warning appears, choose Yes to bring up the design template.
Analyze the Response
Your layout may match what’s shown in the original data table, but there are actually many possible and equally good point selections. To avoid the possibility of a mismatch, but more importantly, to save time, read the response data in by going to Help, Tutorial Data and selecting Sealing. Now click on the Design node on the left.
Notice that the header for the Response 1 column is truncated (Max peel str…). To expand the width of the column automatically, just mouse over the right border until you get the double sided arrow (shown below) and double-click. Now, the whole column header (Max peel strength) can be seen.

Automatically adjusting column width using the double arrow
Under the Analysis branch, click Max peel strength and press the Start Analysis button. Then press the Fit Summary tab.

Fit summary report
Notice that design-for model, quadratic, is suggested. Click the Lack of Fit Tests pane (location will vary depending on pane layout). This looks good (insignificant at p>0.1), so press ahead to the Model tab, then ANOVA with this chosen model.

ANOVA for quadratic model
The statistics are excellent. Some terms come out insignificant, but carry them along by going to the Diagnostics tab (look these over – they shouldn’t alarm you). Now view Model Graphs. This is where it gets intriguing because the suppliers and purchasing agent are anxious to see the findings! Select Perturbation from the Graphs Toolbar to see an overview plot before generating contours and 3D surfaces.

Perturbation plot
Remember that 4.5 lbf is the target, so supplier S1 – chosen by default – is coming out high. Lowering factor C will help bring the response down towards the target value. Return to Contour via the Graphs Toolbar. On the Factors Tool, click the slider for C:Speed and move it left. At the lowest response levels – the defaulting blue-green graduated color shading – see what’s predicted via a right-click and Add flag.

Supplier 1 is not able to produce the target response, even at lowest speed
On the Factors Tool at D:Supplier, select S2 from the drop-down menu to see these results. Then right-click the graph, Add Contour, and drag it near the required 4.5 (if you want to be more precise, right-click the contour and “Set contour value”).

Supplier 2 contour plot
On the Factors Tool, move C:Speed all the way to the right. Then right-click and Add flag near the middle that achieves the response specification. This second supplier (S2) looks much better. With their material, the process need not be pushed too hard in one factor direction or another to meet the critical specification of maximum peel strength on their packaging material.

Supplier 2 is looking good!
On the Factors Tool at D:Supplier, select S3 from the drop-down – it doesn’t look good – the peel strength goes too high again. Return to the Perturbation plot to get an overview of what’s occurring with this supplier. Click Default on the Factors Tool to reset the settings for C:Speed and D:Supplier, then re-select S3 from the drop-down.

Perturbation plot for supplier S3
Notice the high factor C level might allow the 4.5 target to be achieved at certain A and B settings. Go to the Contour graph, and on the Factors Tool slide C:Speed right. Then right-click the graph and select Edit contours.

Edit contour menu
For mode select Incremental. Enter a Start of 0.5, Step of 0.5, and set Levels at 20 (the maximum). Then change Format to 0.0. Click OK.

Changing contour levels
Right-click on the graph and select Graph preferences…. Under Surface Graphs select Std error for 2D Graph Shading (better for black and white printing).

Standard error shading selected for contour graph
Press OK. Click the 4.5 contour line and note where the specification is met by this supplier with the proper process setup. It becomes a red line for easy viewing and tracking.
The contrast on the graph is not sufficient to see what’s going on, so right-click on the shading bar in the legend and select Edit Gradiant Range…. In the Edit Legend dialogue box (see picture below) change the high value to 0.9. This will cause the grey shading to get darker at a lower level, creating more contrast. This trick can be used with a color contour plot, too. Adjusting the high and low levels on the shading bar can create better looking plots with more colors.

The target of 4.5 highlighted as a contour for supplier 3 and std error shading darkened
The red dots represent conditions where actual experimental runs were performed and, in one case, replicated (as indicated by the “2”). Unfortunately, no points are seen near the desired contour. Thus this region is shaded darker to indicate a higher standard error for predictions.
Graphical Optimization
Recall the questions asked at the outset of this tutorial about the new packaging machine developed by the engineers at P&G. We now know the answer to the first one – yes, the process can be adjusted to hit the maximum peel strength target of 4.5 lbf for one or more suppliers.
The purchasing agent intended to break down the supply in this manner: 50% to S1, 25% to S2, and 25% to S3. This led to the second question: Can you find a process setup that works for all suppliers? The contour plots for S1 make it clear that this supplier, despite being favored by the purchasing agent, will not achieve targeted peel strength within current factor levels. That foils the next most acceptable alternative of a two-supplier option with S1 being one of them. (For some reason, hopefully based on cost, the purchasing agent really likes the first supplier!)
All that’s left for the engineers is the following fallback position: If it is not possible to achieve a common setup for even two of the three suppliers, perhaps the upper limit of 6 could be raised on the maximum peel strength specification. (Assume your customers are willing to use scissors or, better yet, package designers can notch the plastic for easier opening.) Will this open a window of operability for multiple suppliers using one set of process conditions?
It’s time to explore the operating windows of each of the three suppliers for making packaging that exceeds 3 lbf (to prevent leaking) and not exceed 6 lbf (making the package too difficult to open). Under the Optimization branch, click the Graphical node. Enter the Limits at Lower 3 and Upper 6.

Criteria for graphical optimization
Click the Graphs tab. You’ll see there’s no operating window at the default settings. On the Factors Tool you must therefore click the bar for C:Speed and slide it left, thus opening a sweet spot for favored supplier (S1).

Sweet spot for supplier 1 at low speed (C)
Next select D:Supplier options for alternatives S2 and S3. Notice only S2 works at this level of C, there’s no window of opportunity for all three suppliers.

Window for supplier 2 at same level of factor C
Now the only remaining alternative is to change D:Supplier back to S1 (left dot), then click and drag the border for Max peel strength to the right, causing it to increase above 6. Go ahead and push it all the way up to near 7. (Better have your scissors handy for opening the package!)

Dragging the border up to 7 for max peel strength
That’s far enough into this case study for tutorial purposes. If you like, click through the other suppliers to see if there’s a common condition where even the newly raised packaging specification can be achieved. The answer may surprise you.