Fraction of Design Space Computations
Fraction of design space (FDS) is primarily used to manage the expectations of the design. It is based on comparing a user-specified, acceptable margin of error or interval half-width (d) to interval estimates computed from user-approved, alpha risk (a), the expected standard deviation (s), along with the design model and the runs in the design (X).
By default, 100,000 random points (xi) are selected and used to calculate the standard error of predicting the mean.
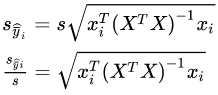
The results of all standard error estimates are sorted and plotted as a cumulative histogram (with the bars removed). The resulting curve provides a way to show what fraction of the possible prediction locations will have no more than a certain level of prediction error.

The user-specified “d” and “s”, along with the t-statistic, derived from the model and design, are used to compute the maximum acceptable standard error threshold.
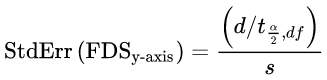
A horizontal line is plotted at the computed threshold. A vertical line is plotted where it intersects the FDS curve. The y-axis value is an estimate for the fraction (proportion) of the design space capable of meeting the precision goal specified by the “d” and “s”.
Fraction of Paired Design Space computations
Fraction of paired design space (FPDS) is primarily used to manage the expectations of the design. It is based on comparing the user supplied size of an important change or difference in the predictions (d) to the standard error of finding a significant difference computed as a function of alpha risk (a), the expected standard deviation (s), the design model and the runs in the design (X).
By default, 100,000 random points (xi) are selected and used to calculate the standard error of the difference. The standard error for detecting a difference is computed by comparing a point to the next point in the sample, and the last point to the first point in the sample.

The i, j pairs are tabulated, sorted and plotted out as a histogram with the bars removed.

The user-specified “d” (difference) and “s”, along with the t-statistic, derived from the model and design, are used to compute the maximum acceptable standard error threshold.
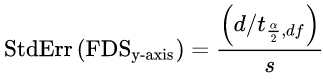
A horizontal line is plotted at the computed threshold. A vertical line is plotted where it intersects the FPDS curve. The y-axis value is an estimate for the fraction (proportion) of the design space capable of meeting the precision goal specified by the “d” and “s”.