Stat-Teaser April 2018

In this issue:
1. The Heaven in Design-Expert Software, Version 11 by Mark Anderson
2. Stat-Ease Trainer Spotlight: Richard Williams
3. Announcing the 7th European DOE User Meeting in Paris, France!
4. Get Up-to-Speed on DOE with Our Instructor-Led Workshops
5. How to Make the Most from Innovative Split-Plot Diagnostics by Martin Bezener
6. Stat-Ease Webinar Available for Viewing: The Magnificent Seven in DX11
The Heaven in Design-Expert Software, Version 11

In my estimation, the newest version of Design-Expert (DX) achieves the greatest improvement in interface since the upgrade from text-based DOS to the first GUI (graphical user interface) in Windows, which came in 1997, that is, 20 years ago. I really like it. That is saying something from a fellow who sheds a tear when finally casting off an old shoe.
Our programming team pulled off a nifty trick by completely revamping what goes on under the covers, thus enabling very cool features such as the notebook options for displaying diagnostics (pictured), while not straying far from the tried-and-true look and feel of Stat-Ease software.
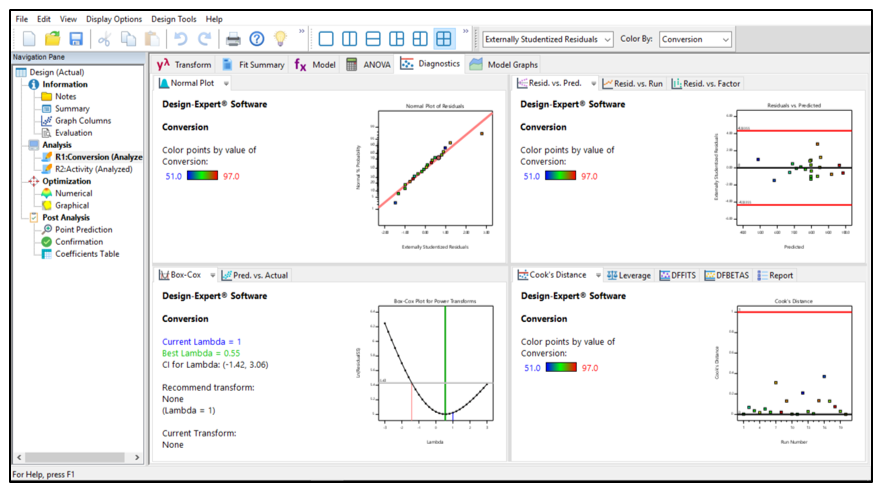
Notebook feature for multigraph view (four-square by default)
Other long-time users like me feel the same way about the nifty balance between new and old, as exemplified by the beta-tester’s comment: “I like the new UI. Definite wow factor, but it still feels the same.” You can find a complete list of DX11 innovation by going to the software page at www.statease.com and clicking on the Features tab. My favorites are:
- Seeing a number of diagnostic plots at a glance (as seen in the image above)
- Dockable toolboxes
- Analysis of variance reports being available in notebook view (split screen)
- Much simpler and more versatile handling of curvature in factorials with center points
- Improved ability to confirm models at multiple points
- The modernized look and feel—very refreshing (but not too radical for ‘experienced’ users).
If you have not checked out DX11 yet, I advise you do so. After all, what a dull life it would be if nothing new came along, or when it does, we never bothered to at least take a look. Try DX11, you will like it!
—by Mark Anderson, mark@statease.com
Stat-Ease Trainer Spotlight: Richard Williams

We are proud to introduce Stat-Ease trainer, Richard Williams. Richard brings to Stat-Ease the skills mastered during his 38-year career with Dow Corning Corporation, along with global product/process development, improvement, and control experience using statistical methods—particularly design of experiments (DOE) and statistical process control. He has a Master of Science degree in Management (MSM) from Boston University (Brussels, Belgium) and a Bachelor of Science degree in Chemical Engineering (BSChE) from the University of Michigan. He is an ASQ Certified Six Sigma Black Belt (CSSBB) as well as a Dow Corning Certified Six Sigma Master Black Belt (MBB). As a MBB he has trained several hundred black belts around the world in six sigma principles, including DOE.
Richard enjoys photography, travel, and time with his family, which includes his wife Ruth, two grown children, and two grandchildren. He also enjoys fitness activities, especially bicycling. See a sample of Richard's beautiful photography below.

"The Tridge", a famous landmark in Midland, MI. Photo by Richard Williams.
If you get the chance to meet Richard in the course of training, please wish him a warm welcome. Learn more about Stat-Ease training, including public workshops, on-site classes, and e-learning through the Stat-Ease Academy, by clicking here.
Announcing the 7th European DOE User Meeting & Workshop in Paris, France!

Stat-Ease, Inc. and Ritme, scientific solutions invite you to attend the 7th European DOE User Meeting & Workshop in Paris, France this June. The DOE User Meeting will be held at Le CNAM (the National Conservatory of Arts and Crafts) in the heart of Paris, close to the Louvre and Notre Dame. This bi-annual event is always a favorite with attendees—both informative and fun! Besides the interesting presentations and learning opportunities, at this year's event in Paris you will have the opportunity to go on a dinner cruise on the River Seine in an all-glass boat, taking in the sights and sounds of this beautiful city!
The conference will include a pre-conference workshop on June 6, followed by the 2-day user meeting on June 7–8 with talks by DOE Experts, as well as practical case study applications by industry practitioners. We will explore the latest design of experiments (DOE) techniques, and demonstrate new features in Design-Expert software, version 11. In addition, you will have the opportunity to get help from DOE consultants on your own particular applications. Our expert trainers are offering a pre-meeting workshop on June 6th. Sign up for Practical DOE “Tricks of the Trade” and learn advanced DOE skills that you can take home and apply. This is your chance to network, increase your DOE knowledge, learn from others' successes and challenges—all while visiting the City of Lights!
You won't want to miss this fun and educational conference in Paris! For more details and to register for the 2-day meeting and/or workshop click here. Many speakers are listed on the web site, but check back later for the complete program.
Dates & Locations
DOE User Meeting, June 7–8, 2018
Location: Le CNAM, 292 rue Saint-Martin, F-75141 Paris Cédex 03
Phone: +33 1 40 27 20 00
Pre-Meeting DOE Workshop, June 6, 2018
Workshop title: Practical DOE "Tricks of the Trade" (Taught by Pat Whitcomb and Mark Anderson of Stat-Ease, Inc.)
Location: Crowne Plaza Paris-Republique, 10, place de la République, 75541 Paris Cedex 11
Phone: +33 1 43144350
For more information and to register for the 7th European DOE User Meeting and/or Workshop, click here.
We hope to see you in Paris! Contact Heidi Hansel Wolfe with any questions. Plan now to attend!
Get Up-to-Speed on DOE with Our Instructor-Led Workshops

Learn how you can make breakthroughs that lead to success with Stat-Ease design of experiments (DOE) workshops. Whether you are just starting out with DOE or are a practiced experimenter, we have a workshop* for you. Our computer-intensive classes include hands-on exercises and one-on-one coaching by experienced instructors. Enroll at least 6 weeks prior to the date to assure your seat—plus get a 10% “early-bird” discount. Find a list of our upcoming public workshops below:
- Experiment Design Made Easy
- Apr 24–25, Minneapolis, Minnesota (MN)
- Jun 19–20, Minneapolis, Minnesota (MN)
- Sep 26–27, Cleveland, Ohio (OH)
- Modern DOE for Process Optimization (MDOE)
- Apr 24–26, Minneapolis, Minnesota (MN)
- Jun 19–21, Minneapolis, Minnesota (MN)
- Sep 26–28, Cleveland, Ohio (OH)
- Mixture and Combined Designs for Optimal Formulations (MIXC)
- Jun 26–28, Minneapolis, Minnesota (MN)
- Oct 22–24, Boston, Massachusetts (MA)
See this web page for complete schedule and site information on all Stat-Ease workshops open to the public. To enroll, click on the name of the workshop you are interested in or scroll down (beneath the calendar) to the workshop of your choice. You may also e-mail workshops@statease.com, or call our Client Specialist, Rachel Pollack, at 612-746-2030. If spots remain available, bring along several colleagues and take advantage of quantity discounts in tuition.
On-Site Training
Consider bringing in an expert from Stat-Ease for private on-site training. Industry-specific classes are available. This is a cost-effective and convenient option if you have 6 or more people to train. For more information on on-site workshops, click here.
Stat-Ease Academy E-Learning
If you can’t make it to one of our instructor-led classes, consider the e-learning options available through the Stat-Ease Academy. At your own pace, master the basics of statistics and learn how to apply DOE to maximum advantage—no traveling necessary! Some courses are available free of charge, while others can be purchased for a small fee.
*Workshops are limited to 16 participants. Receive a $200 quantity discount per class when you enroll 2 or more students, or when a single student enrolls in multiple workshops. For more information, contact Rachel via e-mail or at 612.746.2030.
How to Make the Most from Innovative Split-Plot Diagnostics
The tools for split-plot (SP) design and analysis in Design-Expert (DX) software provide a huge advantage for experimenters with hard-to-change (HTC) factors. However, as explained by this article, the SP diagnostics differ somewhat from those for completely randomized (CR) designs. Before getting into the details, let’s first review what distinguishes a SP from a CR design.
Split-plot vs Completely Randomized Designs
In a CR design, each run is independent of every other run. All factors are completely reset between runs, and measurements are independent of other measurements. Loosely speaking, any error made in one run will not give you information about errors made in other runs.
A SP design becomes necessary when it’s not feasible or practical to reset each factor every run. For example, let’s say you’re experimenting with baking bread with various dough formulations and oven temperatures. A CR design requires you to prepare one loaf of bread (easy to do), heat up the oven to a prespecified temperature (time consuming), and bake the loaf of bread (time consuming). Afterwards, you’ll need to let the oven cool down, and repeat the entire baking process at the conditions spelled out in your experimental recipe sheet. This CR experiment becomes very time consuming due to the heat up and cool down between every run.
To work around this limitation, the SP design holds HTC factor(s) (oven temperature in this case) constant while the remaining easy-to-change (ETC) factors vary from run to run. It would be sensible to re-work our baking experiment into a SP design by putting multiple loaves of bread in the oven at the same time. Note however, that due to the design no longer being completely randomized, the errors are no longer independent of one another. For example, if you set the temperature to 450 degrees F, but the actual temperature only reaches 420 degrees F, all the bread loaves inside the oven will be affected by this error. It’s likely the whole batch will be “off” in this situation.
Because the structure of SP experiments fundamentally differs from that of CR designs, the analysis, and hence diagnostics, will also be different. The exact details of this analysis are beyond the scope of this article but can found in numerous standard textbooks1, 2, one which is provided in the references at the end of this article.
Why the Need for More Diagnostic Plots?
Diagnostic plots provide essential insights into the statistical validity of your chosen model. Many of the SP diagnostic plots remain the same as those in a CR design. This article focuses on three diagnostic plots unique to SP designs: Cook’s Distance Random, Covariance Trace, and the Covariance Ratio.
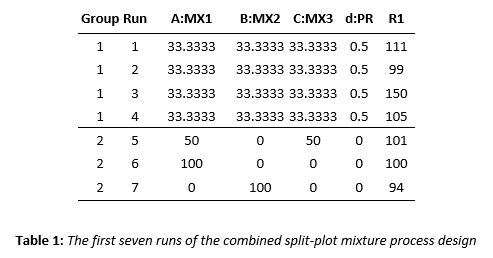
To illustrate these new diagnostics, suppose you run a combined mixture-process experiment on three components (MX1-3), each ranging from 0 to 100%, and one process factor (labeled PR). It’s easy to blend things together, thus the mixture is ETC. However, the process factor takes a lot of effort to adjust, thus it must be handled as HTC via a split-plot design. Using DX, the experimenters set up an 8-group, 26-run I-optimal combined design. Table 1 lays out the first few runs of the design and their responses.
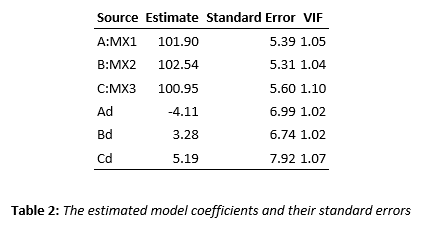
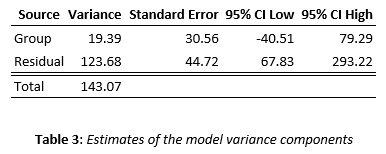
After the data was collected, a linear x linear model was fit to the data. We’ll spare you all the details of analysis, but point out two outputs that we will refer to later: the coefficients in terms of coded factors (Table 2), and the variance components (Table 3).
Now it’s time to check the diagnostics. Remember, we’ll only focus on the diagnostics that are unique to SP designs.
A New Cook’s Distance Diagnostic Geared for SP Designs
Cook’s Distance plot measures how much the regression coefficients change when each run is removed. That is, the influence of each run on the run of the regression model is evaluated. In SP designs, we refer to this plot as the Cook’s Distance Fixed Plot, with “fixed” referring to the regression coefficients.
However, runs can also influence the variance components in SP models. But runs that influence the model coefficients do not necessarily influence the variance components of the model, and vice versa, hence the need for a second plot. Figure 1 displays both Cook’s Distance plots.
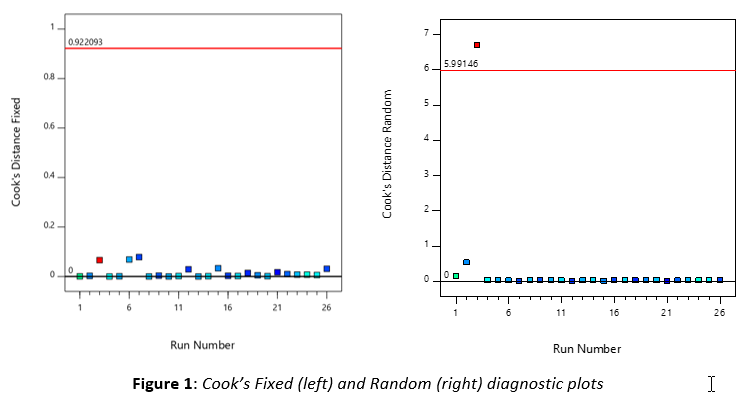
The Cook’s Distance Fixed (CDF) plot (left) doesn’t indicate any points that highly influence the regression coefficients in Table 2. However, the Cook’s Distance Random (CDR) plot (right) indicates that run #3 is highly influential on the variance components. Let’s see what happens if we remove run #3 and re-fit the same model. The changes in variance components (Table 4) tell the story—a very good one.
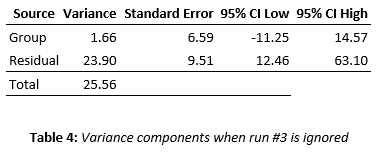
The total variance is reduced by over 80 percent (143 to 25.5)! What’s going on? The answer comes by inspecting the result from run #3 in Table 1—one in a group of four center points. The response of 150 stands out from the other three runs before and after. However, the CDF diagnostic plot fails to provide an alarm: Run #3’s influence on the fitted model remains minimal due to many other center points in the design drowning it out. Fortunately, DX provides the CDR diagnostic plot, which reveals a huge influence by run #3 on the estimated variability. Inspection of logs revealed an actual result of 105—it being typed in incorrectly as 150!
This example points out the importance for checking both the Cook’s Fixed and Random plots when running a split-plot design. If any points jump above the red line, investigate that run. A special cause may then be revealed, such as a typo or equipment malfunction, that dictates that result be changed or ignored. But if no reason emerges for the point being unusually influential, do not change it.
Two More SP-Specialized Diagnostics: Covariance Ratio and Trace
The Covariance Ratio plot (Figure 2, left) measures the influence of each point on the standard errors of the fitted model coefficients. Outlying points on this plot—any falling below the red line--will inordinately impact the power of your design. The Covariance Trace (Figure 2, right) provides a similar measure, however, it doesn’t take the correlations between the estimated model coefficients into account. Also, it does not lend itself to imposing a cutoff, which hinders making judgement calls.
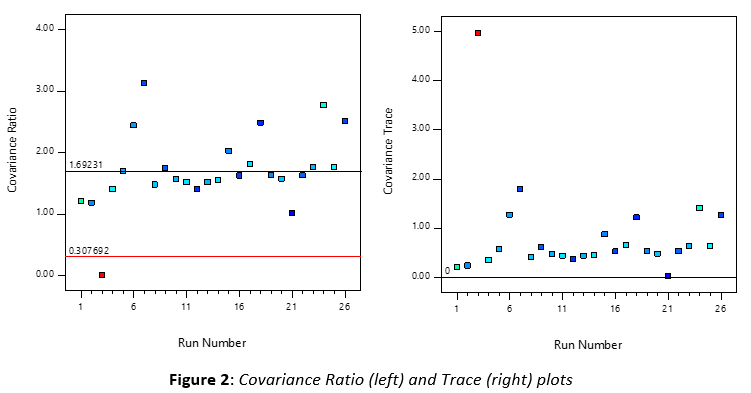
Note that run #3 is once again revealed to be highly influential. Refitting the model without this discrepant result produces a major reduction—roughly one-third lower—in model-coefficient standard errors (Table 5).
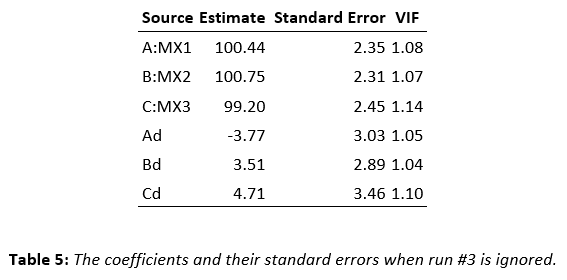
The reduced standard errors lead to higher power, more precise predictive surfaces, and, in general, a more stable model.
Due to it providing a cutoff, we advise you to focus on the Covariance Ratio rather than the Trace plot. Any points below the red line deserve extra attention and scrutiny.
Conclusion
Diagnostics are a tricky subject, with many of the plots being interconnected and related to one another. Also, as always, subject matter knowledge must be applied for proper interpretation of anomalies. This article provided insights into innovative new diagnostic tools provided by Design-Expert for split-plot experiments. You are now equipped with a powerful tool to detect issues with particular responses and thus build better statistical models going forward.
—by Martin Bezener, martin@statease.com
References
1Mark J. Anderson and Patrick J. Whitcomb (2015), DOE Simplified (Third Edition), CRC Press
2Ronald Christensen et al. (1992), Case-Deletion Diagnostics for Mixed Models, Technometrics, Vol 34, No 1, pages 38-45
Stat-Ease Webinar Available for Viewing: The Magnificent Seven in DX11

Visit our Webinars page to view recordings of other past presentations.