Blocking: Mowing the Grass in Your Experimental Backyard
One challenge of running experiments is controlling the variation from process, sampling and measurement. Blocking is a statistical tool used to remove the variation coming from uncontrolled variables that are not part of the experiment. When the noise is reduced, the primary factor effects are estimated more easily, which allows the system to be modeled more precisely.
For example, an experiment may contain too many runs to be completed in just one day. However, the process may not operate identically from one day to the next, causing an unknown amount of variation to be added to the experimental data. By blocking on the days, the day-to-day variation is removed from the data before the factor effects are calculated. Other typical blocking variables are raw material batches (lots), multiple “identical” machines or test equipment, people doing the testing, etc. In each case the blocking variable is simply a resource required to run the experiment-- not a factor of interest.
Blocking is the process of statistically splitting the runs into smaller groups. The researcher might assume that arranging runs into groups randomly is ideal - we all learn that random order is best! However, this is not true when the goal is to statistically assess the variation between groups of runs, and then calculate clean factor effects. Design-Expert® software splits the runs into groups using statistical properties such as orthogonality and aliasing. For example, a two-level factorial design will be split into blocks using the same optimal technique used for creating fractional factorials. The design is broken into parts by using the coded pattern of the high-order interactions. If there are 5 factors, the ABCDE term can be used. All the runs with “-” levels of ABCDE are put in the first block, and the runs with “+“ levels of ABCDE are put in the second block. Similarly, response surface designs are also blocked statistically so that the factor effects can be estimated as cleanly as possible.
Blocks are not “free”. One degree of freedom (df) is used for each additional block. If there are no replicates in the design, such as a standard factorial design, then a model term may be sacrificed to filter out block-by-block variation. Usually these are high-order interactions, making the “cost” minimal.
After the experiment is completed, the data analysis begins. The first line in the analysis of variance (ANOVA) will be a Block sum of squares. This is the amount of variation in the data that is due to the block-to-block differences. This noise is removed from the total sum of squares before any other effects are calculated. Note: Since blocking is a restriction on the randomization of the runs, this violates one of the ANOVA assumptions (independent residuals) and no F-test for statistical significance is done. Once the block variation is removed, the model terms can be tested against a smaller residual error. This allows factor effects to stand out more, strengthening their statistical significance.
Example showing the advantage of blocking:
In this example, a 16-blend mixture experiment aimed at fitting a special-cubic model is completed over 2 days. The formulators expect appreciable day-to-day variation. Therefore, they build a 16-run blocked design (8-runs per day). Here is the ANOVA:
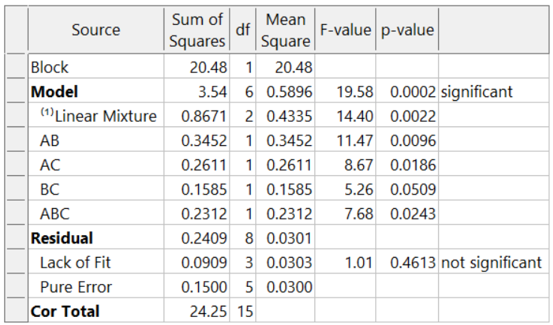
The adjusted R² = 0.8884 and the predicted R² = 0.7425. Due to the blocking, the day-to-day variation (sum of squares of 20.48) is removed. This increases the sensitivity of the remaining tests, resulting in an outstanding predictive model!
What if these formulators had not thought of blocking and, instead, simply, run the experiment in a completely randomized order over two days? The ANOVA (again for the designed-for special-cubic mixture model) now looks like this:
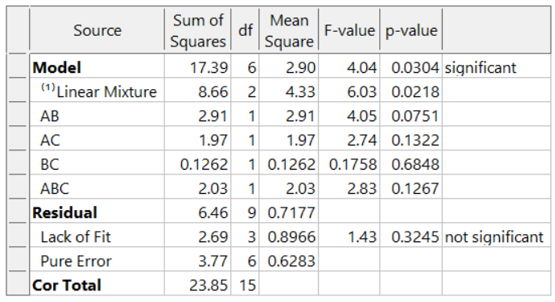
The model is greatly degraded, with adjusted R² = 0.5487, and predicted R² = 0.0819 and includes many insignificant terms. While the blocked model shown above explains 74% of the variation in predictions (the predicted R-Square), the unblocked model explains only 8% of the variation in predictions, leaving 92% unexplained. Due to the randomization of the runs, the day-to-day variation pollutes all the effects, thus reducing the prediction ability of the model.
Conclusion:
Blocks are like an insurance policy – they cost a little, and often aren’t required. However, when they are needed (block differences large) they can be immensely helpful for sorting out the real effects and making better predictions. Now that you know about blocking, consider whether it is needed to make the most of your next experiment.
Blocking FAQs:
How many runs should be in a block?
My rule-of-thumb is that a block should have at least 4 runs. If the block size is smaller, then don’t use blocking. In that case, the variable is simply another source of variation in the process.
Can I block a design after I’ve run it?
You cannot statistically add blocks to a design after it is completed. This must be planned into the design at the building stage. However, Design-Expert has sophisticated analysis tools and can analyze a block effect even if it was not done perfectly (added to the design after running the experiment). In this case, use Design Evaluation to check the aliasing with the blocks, watching for main effects or two-factor interactions (2FI).
Are there any assumptions being made about the blocks?
There is an assumption that the difference between the blocks is a simple linear shift in the data, and that this variable does not interact with any other variable.
I want to restrict the randomization of my factor because it is hard to change the setting with every run. Can I use blocking to do this?
No! Only block on variables that you are not studying. If you need to restrict the randomization of a factor, consider using a split-plot design.