Stat-Teaser March 2015
In this issue:
1. New Split-Plot Tools a Soaring Success for Helicopter Development by Mark Anderson
2. Understanding Aliasing of Fractional-Factorial Designs by Wayne Adams
3. Stat-Ease Announces a Strategic Partner Agreement with CAMO Software
4. The 1st Asian DOE User Meeting & Workshop this May in Goa, India
5. Stat-Ease Welcomes Martin Bezener as Full-Time Statistician
6. Workshop Schedule
New Split-Plot Tools a Soaring Success for Helicopter Development
Building paper helicopters is well-established for a hands-on learning experience in design of experiments (DOE). Templates for cutting out and folding these ‘copters are widely available. The one pictured in Figure 1 provides an idea of how these shape up. Note this one being counter-balanced by a paper clip—a factor to consider along with the dimensions of wing and body. The goal for DOE students is to develop a paper helicopter that flies the longest with an on-target landing. See http://tinyurl.com/PaperCopter for an awesome flight filmed by Stat-Ease Consultant Brooks Henderson at his alma mater—the South Dakota School of Mines and Technology (SDSMT) in Rapid City—where we’ve been doing an annual DOE teach for many years.

Figure 1: Paper helicopter
For well over a decade I’ve overseen paper helicopter experiments twice a year for Six Sigma blackbelt classes at the Ohio State University’s Fisher College of Business. When version 9 of Design-Expert® software (DX9) achieved release, I couldn’t wait to apply its new split-plot tools for handling hard-to-change factors to ‘copter development.
Experimental details
Inspired by news of a supreme paper—Conqueror CX22—made into an airplane that broke the Guinness World Record™ for greatest distance flown, Brooks and I designed a split-plot experiment on paper helicopters. We put CX22 to the test against a standard copy paper used for Stat-Ease workshop notes. As laid out below, five other factors were added to round out the flight testing via a half-fraction, high-resolution (Res VI) two-level design with 32 runs (=26-1):
a. Paper: 24# Navigator Premium (standard) versus 26.6# Conqueror CX22 (supreme)
b. Wing* Length: Short vs Long (*technically a rotor in aviation terms)
c. Body Length: Short vs Long
d. Body Width: Narrow vs Wide
E. Clip: Off vs On
F. Drop: Bottom vs Top
Being attributes of construction, the first four factors (identified with lower-case letters) are hard to change, that is, HTC. The other factors come into play in the flights (operation). They are easy to change—ETC.
To develop the longest flying, most accurate helicopter the experimenters measured these two responses (Y):
- Average time in seconds for three drops from ceiling height
- Average deviation in centimeters from target
The averaging dampened out drop-to-drop variation, which, due to human factors in the release, air drafts and so forth, can be considerable.
We enlisted a staffer at Stat-Ease with the patience and skills (both of these attributes being attributes I sorely lack) needed for constructing the paper helicopters—Communications Specialist Karen Dulski. Grouping the HTCs by the number of flying machines into whole plots as shown in Table 1 reduced her manufacturing time by one half.

Table 1: Partial listing (first three groups and the last) of 32-run split-plot test plan
After the 16 helicopters were built (numbered by Group with a marker), the engineers put each one (in run order) to the test with combinations of the two ETC factors as noted in the table.
Trade-off of power for convenience when restricting randomization
As shown in Table 2, of the two responses, the distance from target (Y2) produced the lowest signal-to-noise ratio. It was based on a 5 cm minimal deviation of importance relative to a 2 cm standard deviation measured from prior repeatability studies.

Table 2: Signal to noise for the two paper helicopter responses
The number of runs required for a given level of adequate power (generally acceptable at 80%) increases exponentially as signal-to-noise ratio decreases, therefore Y2 is the limiting response. After we entered a whole-plot to split-plot variance ratio of 2 (a value arrived at from previous studies) the 2.5 signal-to-noise ratio for the 32-run two-level factorial design generated the power shown in Table 3.

Table 3: Power for main effects for design being done as split plot versus fully randomized
What’s really important to see here is that by grouping the HTC factors the experimenters lost power versus a completely randomized design. (It mattered little in this case, but it must be noted that the other factors—the ETCs—gained a bit more power, going from 97.5% to 99.8%.) However, the convenience and cost savings (the CX22 stock being extremely expensive) of only building half the paper helicopters—16 out of the 32 required in the fully-randomized design of experiments—outweighed the loss in power, which in any case remained above the generally acceptable level of 80%. Thus the split-plot test plan laid out in Table 2 got the ‘thumbs-up’ from the flight engineers.
Results
As shown by the aE interaction plot in Figure 2, the paper type (a) interacted significantly (p<0.5) with the choice of paper clip (E). With the paper clip on the flight times dropped greatly, but not so much with the heavier CX22 paper (the green triangled line).
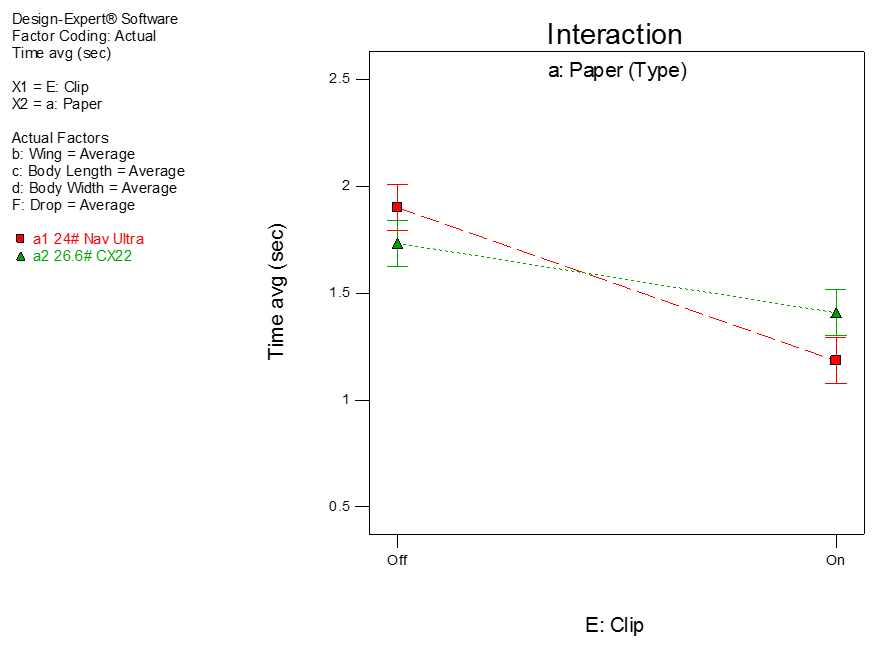
Figure 2: Interaction of paper type
To maintain an accurate flight, putting on the paper clip becomes mandatory—weight being the key to allowing gravity to rule over the tendency of the aircraft drifting off course. Figure 3 shows the multiple response optimization results from DX9, aiming at the most desirable tradeoff of long very accurate flights that perform most consistently (least standard deviation).
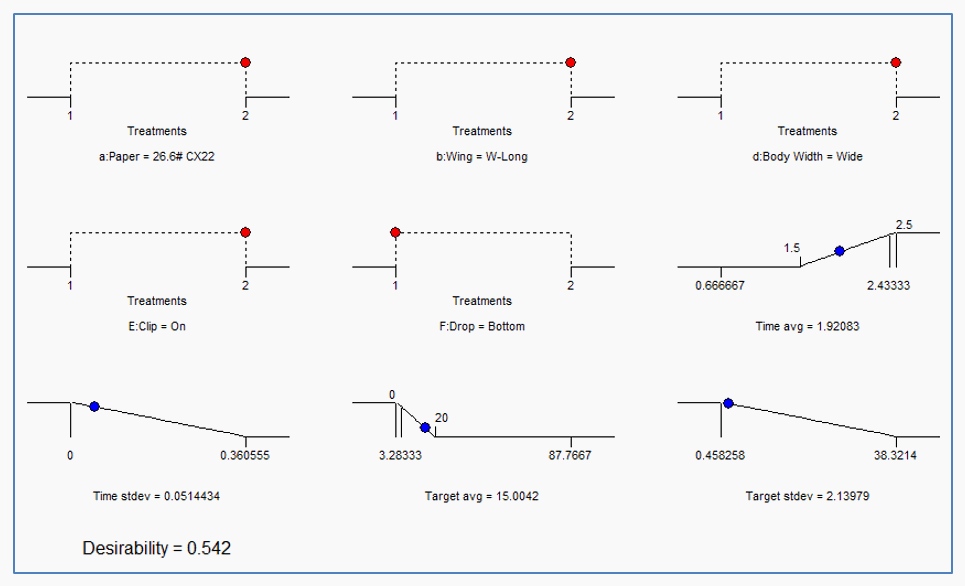
Figure 3: Multiple response optimization results
In the end the CX22 paper did indeed conquer!
Conclusion
Much more could be said about split plots and the results of this experiment in particular. However, this would go outside the scope of my main takeaways, these being:
- Applying split-plot design to accommodate hard-to-change factors
- Understanding that a price must be paid in statistical power for the convenience of restricting randomization.
And related to this particular exercise:
- ‘Right-sizing’ the test plan on the basis of power to accommodate the need to reduce the helicopter builds via split-plot design.
I really enjoyed putting DX9’s new split-plot tools to this task. Most people toss paper around a classroom or office when they get really bored and the teacher or boss isn’t looking. It’s great to have a job where flying paper helicopters can be considered productive work (at least for one go-around). : )
—Mark, mark@statease.com
P. S. If you use DX9 and would like to go over the data from this experiment, e-mail me for the file.
↑Go back to the top
Understanding Aliasing of Fractional-Factorial Design
Using a case study on microwave popcorn, Wayne Adams leads us through an explanation of what aliasing is, and why it is important to pay attention to it.
Case study: a 4-run fractional-factorial DOE
Microwave popcorn is a favorite at Stat-Ease, Inc. We have enjoyed several experiments cooking popcorn in various ways. One of our common metrics for quantifying popcorn output is a taste rating.
Hoping to obtain some quick results, we completed a 4-run design on three factors. We wanted to know if brand (cheap or costly), microwave time, or microwave power setting would have an effect on the popcorn taste. The half-normal plot in Figure 1 seems to confirm that all three factors affect taste. Would you believe that the taste of the popcorn depends on the brand?
Figure 1: Half-normal plot for half-fraction (23-1) resolution III design
Visual inspection of the popcorn (Figure 2) seems to confirm this result. The costly brand of popcorn burns half the time, yielding poor taste. The cheap popcorn doesn't burn at all, thus tastes better. The popcorn also burns half the time when high power is used, and half the time when cooked for too long.
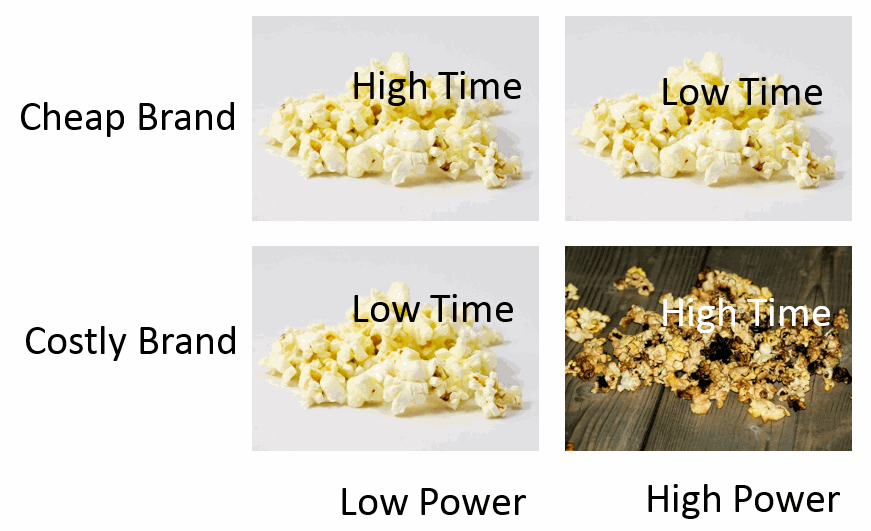
Figure 2: Visual inspection of the popcorn
Someone with experience popping popcorn might notice that only the combination of costly brand + high power + high time burned. They might pose the question, "Is it the costly popcorn, or the combination of high power and long (high) time?" Someone with experience with design of experiments might realize that the design was too small to resolve the aliasing between the main effects and the interactions.
Design-Expert® software provides experimenters with alias information as they navigate the build screens.

Figure 3: Alias screen during design build
What does this mishmash of numbers and letters mean? Why should the experimenter look at it?
A quick review of the concept of the model matrix (X) is necessary. The X matrix has one row for each run in the design and one column for each term in the design model. The first column is a column of all +1 and represents the intercept term in the polynomial model. The columns associated with the terms in the model are coded to have a minimum of -1 and a maximum of +1.

Table 1: Model matrix for a 23-1 design
The main effects are the columns associated with the factors themselves (in this case A, B, and C). These columns, highlighted in blue, are identical to the Design Layout spreadsheet found in Design-Expert. The two-factor interaction (2FI) columns are created by multiplying two main effects columns together; likewise the 3FI column multiplies three main effects columns together. Looking at the first row, A = 1, B = -1, and C = -1. Therefore AB = 1 * -1, AC = 1 * -1, BC = -1 * -1, and ABC = 1 * -1 * -1.
When the columns in the X matrix are identical, those terms are completely aliased. In Table 1, the intercept is identical to the 3FI column, A is the same as BC, B is the same as AC, and C is the same as AB.
Why is this important to look at?
The alias list is intended to give the experimenter a chance to review the information that will be obtained before continuing with the design build. If terms that are fairly likely to be significant are aliased with each other, a different design can be chosen before any resources are wasted on an insufficient design.
For this case study, it shows that the main effects are completely aliased with the 2FI's.
[Intercept] = Intercept + ABC
[A] = A + BC
[B] = B + AC
[C] = C + AB
Figure 4: Alias Structure of a 23-1 Resolution III design
The terms in the brackets are model terms, the terms to the right of the equal sign are aliased terms. The [A] line can be read, "What we are calling [A] is really the sum of A and BC.” Another way to interpret this is: if the BC interaction is active, the Brand effect estimate is biased and will report the wrong value.
What can be done about the aliasing?
Aliasing can only be fixed with more unique runs. If the example had started with the 8-run full-factorial design the complete story would have been revealed. As shown in Figure 5, for this particular case study the taste of the popcorn actually depends on time (B), power (C) and the interaction between time and power (BC). The half-fraction 4-run design, where the main effects are completely aliased with two-factor interactions, is unable to separate the BC interaction's effect from the A-Brand main effect (Figure 1). It would be very easy to accept this incorrect conclusion and move on to the next project. The experimenter would have to have prior knowledge that Brand does not have a substantial effect on taste to draw the correct conclusion from the design shown in Figure 1.
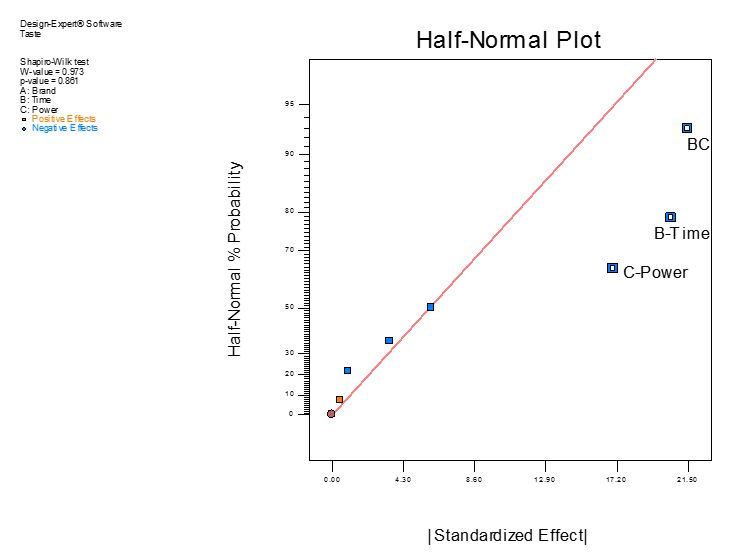
Figure 5: Half-normal plot for full-factorial (23) design
Runs can be added to an existing design to fix the aliasing. The downside is a design augmentation requires at least one more run than starting with the best design from the beginning.
Check the alias list when building fractional-factorial designs; check to make sure the design can provide the information you need to make good decisions. If the goal is to understand which factors may be important, it is necessary to make sure the two-factor interactions are not aliased with main effects. It only takes a few seconds to look at the alias list (Figure 3) when it is presented as part of the build.
—Wayne Adams, wayne@statease.com
↑Go back to the top
Stat-Ease Announces a Strategic Partnership with CAMO Software
Stat-Ease is pleased to announce that we have entered into a strategic partner agreement with CAMO Software, a leading provider of multivariate analysis (MVA) software and services. CAMO will bundle Stat-Ease’s Design-Expert® software with CAMO’s The Unscrambler® X. Customers will have access to two world-leading software packages providing advanced data analysis in one integrated solution.
At Stat-Ease, we are very excited about this collaboration. It will provide CAMO with a broader product and service offering to new and existing clients, and offer Stat-Ease a global extension to our sales and marketing organization.
We are also pleased to announce that Pat Whitcomb, founder and president of Stat-Ease, Inc., and Mark Anderson, principal of Stat-Ease, Inc., will be joining CAMO at their User Meeting in Prague in April. They will be speaking on "Managing Uncertainty in a Design Space" and "DOE Simplified— Practical Tools for Effective Experimentation".
Click here to read the agenda and to sign up for CAMO’s User Meeting. To learn more about CAMO Software, click here. The Unscrambler X bundle with Design-Expert software is not yet available. If you would like to upgrade to this new solution, stay tuned for future announcements.
The 1st Asian DOE User Meeting & Workshop this May in Goa, India
Stat-Ease, Inc. and Systech Technocraft Services are hosting the 1st Asian DOE User Meeting & Workshop in Goa, India the 27-29 of May. The DOE User Meeting will be on the first day of the event, featuring presentations by keynote speakers as well as practical case study applications by DOE practitioners. It will focus on the latest advances in design of experiments (DOE) techniques, demonstrate important features in Design-Expert® software, version 9, and share the latest news from Stat-Ease. On days 2 & 3 of the meeting a DOE workshop on Designed Experiments for Pharma (DEPH) will be held. While the examples in class will be from the pharmaceutical industry, the DOE concepts and techniques taught are applicable to any area. You are welcome to sign up for the workshop no matter what industry you are in! Don't miss this chance to network, increase your DOE knowledge, learn from others' successes and challenges, and visit Goa—one of Asia's top tourist spots with its white beaches and fascinating history! Learn more and register here.
Dates & Location
May 27, 2015: DOE User Meeting
May 28-29, 2015: 2-Day Designed Experiments for Pharma (DEPH) Workshop (see outline here)
Vivanta by Taj - Panaji
Off D. B. Bandodkar Rd
Panaji
Goa - 403 001
India
p: +91 832 663 3636
f: +91 832 663 3600
Call for Speakers
We invite you to present a case study application in Goa on a designed experiment that you have done. Did you have success or learn something valuable in the process? We’d love to hear about it. If you are interested in giving a 20-minute talk, send a proposal including the title and a short abstract (up to 250 words) to Heidi Hansel Wolfe by March 31st, 2015. The DOE User Meeting registration fee (INR 1000) will be waived for presenters. There are a limited number of speaker slots available.
Stat-Ease Welcomes Martin Bezener as Full-Time Statistician
Martin Bezener, PhD
Stat-Ease is pleased to introduce our new statistician, Martin Bezener. Martin started with Stat-Ease as an intern in May 2012 and agreed to join us full-time last November after completing his PhD in Statistics from the University of Minnesota, Twin Cities (the alma mater of Stat-Ease's founding members!). Martin got his BS degree in Mathematics from Loyola University in Chicago in 2009. He likes the field of statistics because it allows him to combine his interests in mathematics, computing, and solving real-world problems.
Martin's primary responsibility at Stat-Ease is the development of Design-Expert® software. He also teaches workshops and does consulting. He recently conducted a webinar on Practical Strategies for Model Verification, which you can download and view at http://www.statease.com/training/webinar.html.
Born and raised in Chicago, IL, Martin is used to Midwest winters so living in Minnesota is no problem. He enjoys city life and now resides in Northeast Minneapolis. His interests outside of work include playing keyboards and learning languages.
Martin has already proved himself invaluable to Stat-Ease and we are very happy to have him as a member of the team!
Workshop Schedule
Experiment Design Made Easy (EDME)
May 13-14: San Diego, CA
Jul 20-21: Edison, NJ
Sep 29-30: Minneapolis, MN
$1295 ($1095 each, 2 or more)
Factorial Split-Plot Designs for Hard-to-Change Factors (FSPD—Half Day)
May 15: San Diego, CA
$395 ($295 each, 2 or more)
Response Surface Methods for Process Optimization (RSM)
Jul 22-23: Edison, NJ
Oct 1-2: Minneapolis, MN
$1295 ($1095 each, 2 or more)
Mixture Design for Optimal Formulations (MIX)
May 5-6: Minneapolis, MN
Aug 11-12: Minneapolis, MN
$1295 ($1095 each, 2 or more)
Advanced Formulations: Combining Mixture & Process Variables (MIX2)
Aug 13-14: Minneapolis, MN
$1495 ($1195 each, 2 or more)
PreDOE: Basic Statistics for Experimenters Online Course
Free (a $95 value). Learn more here.
Workshops are limited to 16. Receive a $200 quantity discount per class when you enroll 2 or more students, or when a single student enrolls in consecutive 2-day workshops. Receive a $100 discount on the FSPD workshop when registering for it along with another class.
For more information, contact Rachel at 612.746.2038 or via e-mail.


