Greg’s DOE Adventure - Factorial Design, Part 1
[Disclaimer: I’m not a statistician. Nor do I want you to think that I am. I am a marketing guy (with a few years of biochemistry lab experience) learning the basics of statistics, design of experiments (DOE) in particular. This series of blog posts is meant to be a light-hearted chronicle of my travels in the land of DOE, not be a text book for statistics. So please, take it as it is meant to be taken. Thanks!]
So, I’ve gotten thru some of the basics (Greg's DOE Adventure: Important Statistical Concepts behind DOE and Greg’s DOE Adventure - Simple Comparisons). These are the ‘building blocks’ of design of experiments (DOE). However, I haven’t explored actual DOE. I start today with factorial design.
We can illustrate like this:
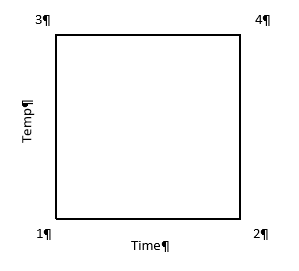
In this case, the horizontal line (x-axis) is time and vertical line (y-axis) is temperature. The area in the box formed is called the Experimental Space. Each corner of this box is labeled as follows:
1 – low time, low temperature (resulting in crunchy, matchstick-like pasta), which can be coded minus-minus (-,-)
2 – high time, low temperature (+,-)
3 – low time, high temperature (-,+)
4 – high time, high temperature (making a mushy mass of nasty) (+,+)
One takeaway at this point is that when a test is run at each point above, we have 2 results for each level of each factor (i.e. 2 tests at low time, 2 tests at high time). In factorial design, the estimates of the effects (that the factors have on the results) is based on the average of these two points; increasing the statistical power of the experiment.
Power is the chance that an effect will be found, when there is an effect to be found. In statistical speak, power is the probability that an experiment correctly rejects the null hypothesis when the alternate hypothesis is true.
If we look at the same experiment from the perspective of altering just one factor at a time (OFAT), things change a bit. In OFAT, we start at point #1 (low time, low temp) just like in the Factorial model we just outlined (illustrated below).
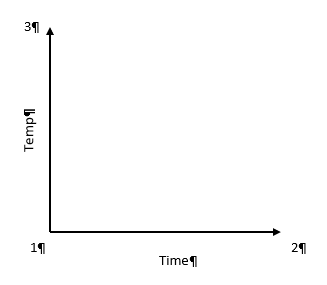
Here, we go from point #1 to #2 by lengthening the time in the water. Then we would go from #1 to #3 by changing the temperature. See how this limits the number of data points we have? To get the same power as the Factorial design, the experimenter will have to make 6 different tests (2 runs at each point) in order to get the same power in the experiment.
After seeing these results of Factorial Design vs OFAT, you may be wondering why OFAT is still used. First of all, OFAT is what we are taught from a young age in most science classes. It’s easy for us, as humans, to comprehend. When multiple factors are changed at the same time, we don’t process that information too well. The advantage these days is that we live in a computerized world. A computer running software like Design-Expert®, can break it all down by doing the math for us and helping us visualize the results.
Additionally, with the factorial design, because we have results from all 4 corners of the design space, we have a good idea what is happening in the upper right-hand area of the map. This allows us to look for interactions between factors.
That is my introduction to Factorial Design. I will be looking at more of the statistical end of this method in the next post or two. I’ll try to dive in a little deeper to get a better understanding of the method.