Augmenting One-Factor-at-a-Time Data to Build a DOE
I am often asked if the results from one-factor-at-a-time (OFAT) studies can be used as a basis for a designed experiment. They can! This augmentation starts by picturing how the current data is laid out, and then adding runs to fill out either a factorial or response surface design space.
One way of testing multiple factors is to choose a starting point and then change the factor level in the direction of interest (Figure 1 – green dots). This is often done one variable at a time “to keep things simple”. This data can confirm an improvement in the response when any of the factors are changed individually. However, it does not tell you if making changes to multiple factors at the same time will improve the response due to synergistic interactions. With today’s complex processes, the one-factor-at-a-time experiment is likely to provide insufficient information.
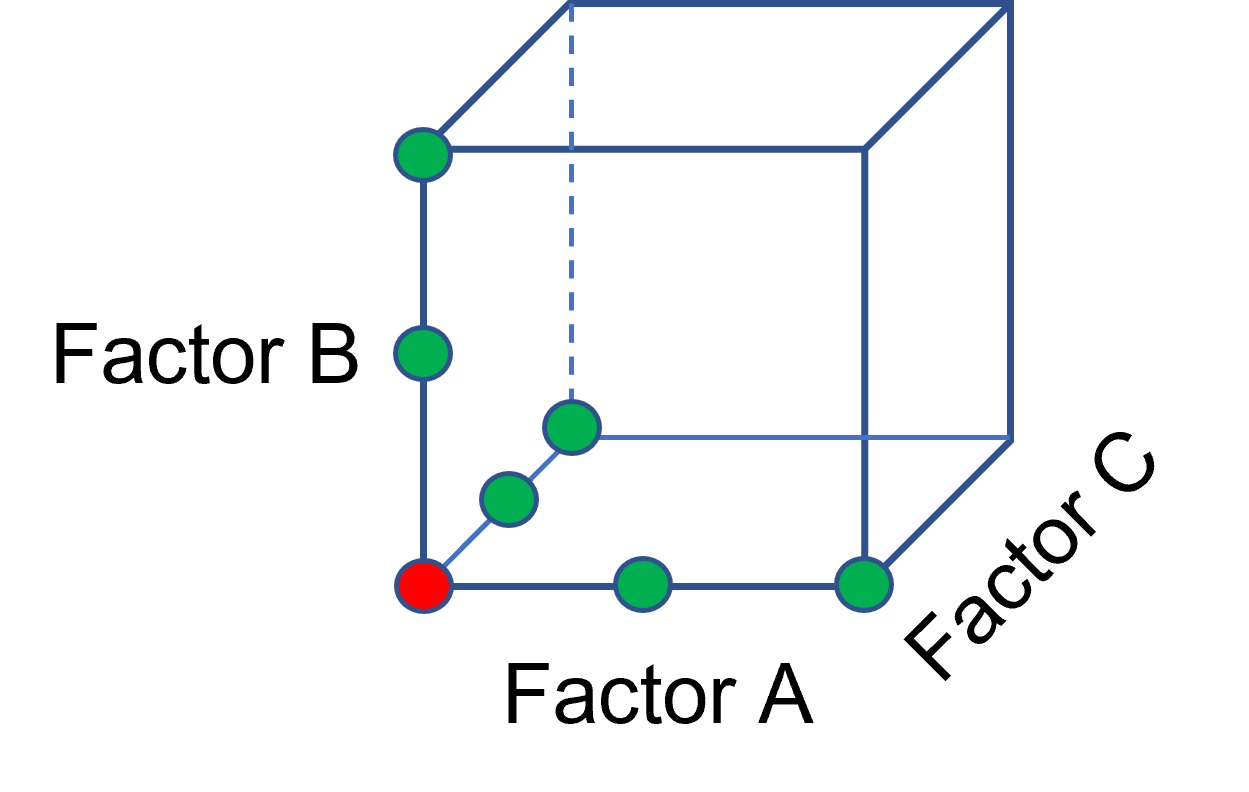
Figure 1: OFAT
The experimenter can augment the existing data by extending a factorial box/cube from the OFAT runs and completing the design by running the corner combinations of the factor levels (Figure 2 – blue dots). When analyzing this data together, the interactions become clear, and the design space is more fully explored.
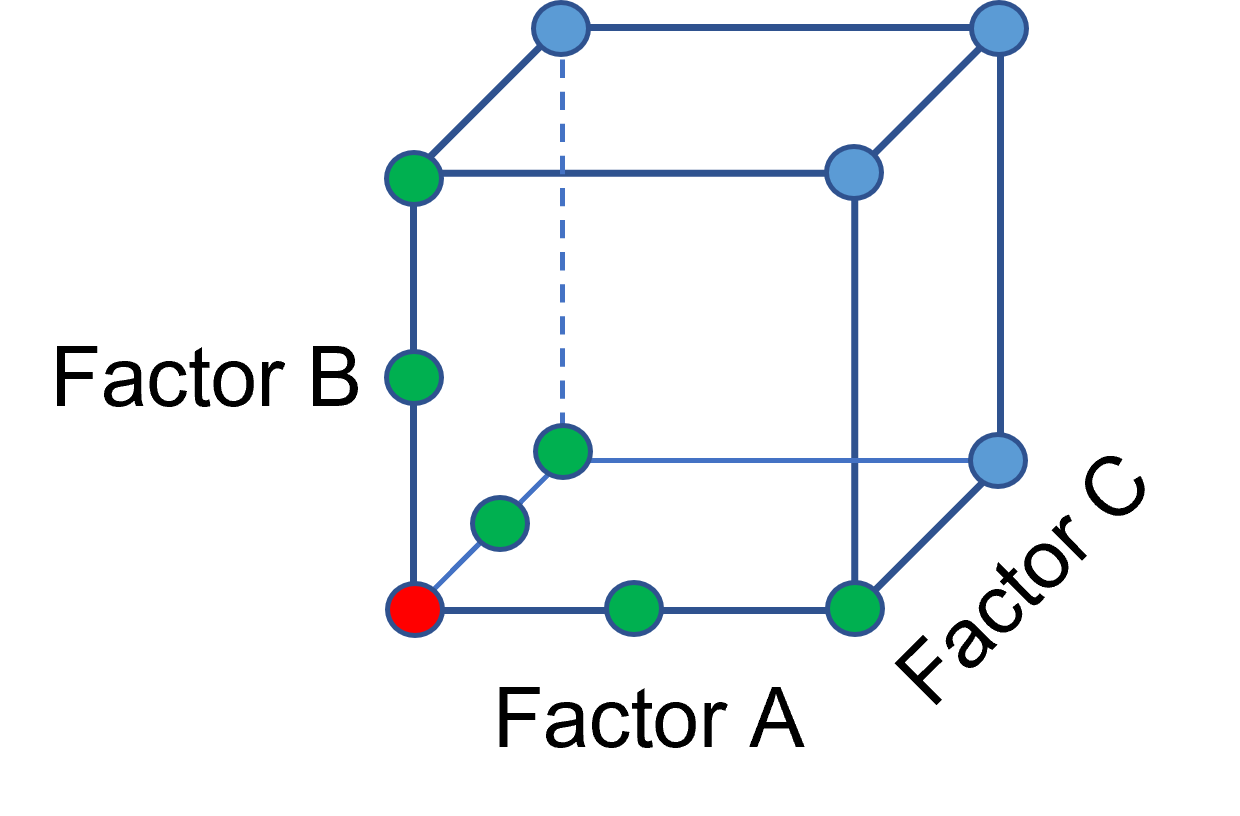
Figure 2: Fill out to factorial region
In other cases, OFAT studies may be done by taking a standard process condition as a starting point and then testing factors at new levels both lower and higher than the standard condition (see Figure 3). This data can estimate linear and nonlinear effects of changing each factor individually. Again, it cannot estimate any interactions between the factors. This means that if the process optimum is anywhere other than exactly on the lines, it cannot be predicted. Data that more fully covers the design space is required.
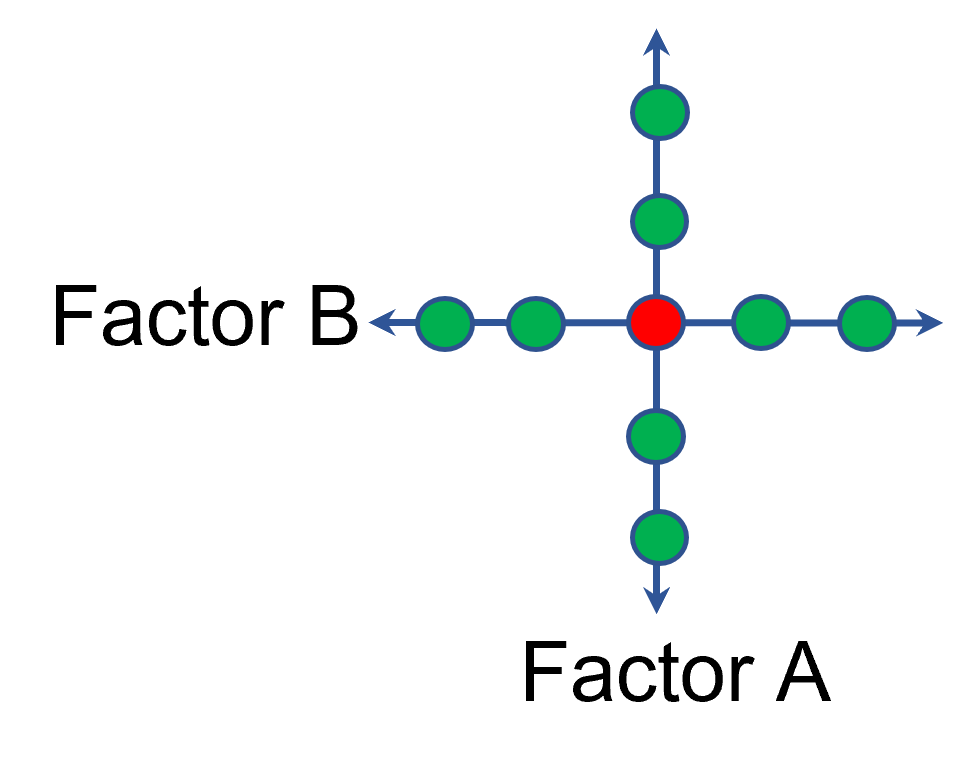
Figure 3: OFAT
A face-centered central composite design (CCD)—a response surface method (RSM)—has factorial (corner) points that define the region of interest (see Figure 4 – added blue dots). These points are used to estimate the linear and the interaction effects for the factors. The center point and mid points of the edges are used to estimate nonlinear (squared) terms.
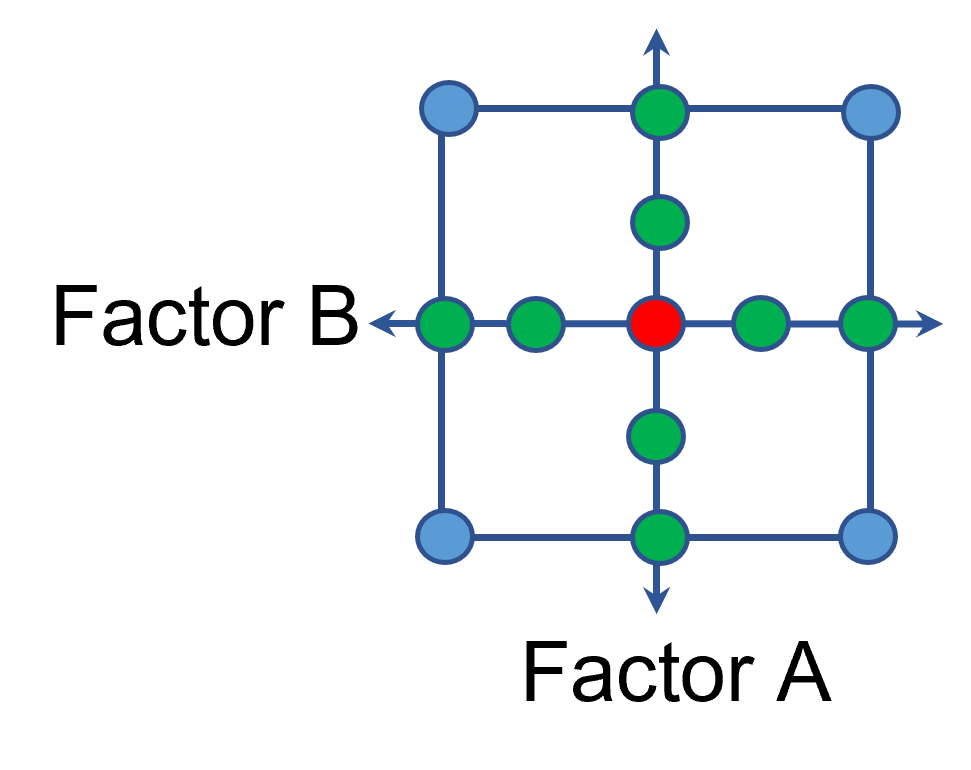
Figure 4: Face-Centered CCD
If an experimenter has completed the OFAT portion of the design, they can augment the existing data by adding the corner points and then analyzing as a full response surface design. This set of data can now estimate up to the full quadratic polynomial. There will likely be extra points from the original OFAT runs, which although not needed for model estimation, do help reduce the standard error of the predictions.
Running a statistically designed experiment from the start will reduce the overall experimental resources. But it is good to recognize that existing data can be augmented to gain valuable insights!
Learn more about design augmentation at the January webinar: The Art of Augmentation – Adding Runs to Existing Designs.