Adding Intervals to Optimization Graphs
Design-Expert® software provides powerful features to add confidence, prediction, or tolerance intervals to its graphical optimization plots. All users can benefit by seeing how this provides a more conservative ‘sweet spot’. However, this innovative enhancement is of particular value for those in the pharmaceutical industry who hope to satisfy the US FDA’s QbD (quality by design) requirements.
Here are the definitions:
Confidence Interval (CI): an interval that covers a population parameter (like a mean) with a pre-determined confidence level (such as 95%.)
Prediction Interval (PI): an interval that covers a future outcome from the same population with a pre-determined confidence level.
Tolerance Interval (TI): an interval that covers a fixed proportion of outcomes from the population with a pre-determined confidence level for estimating the population mean and standard deviation. (For example, 99% of the product will be in spec with 95% confidence.)
Note that a confidence interval contains a parameter (σ, μ, ρ, etc.) with “1-alpha” confidence, while a tolerance interval contains a fixed proportion of a population with “1-alpha” confidence.
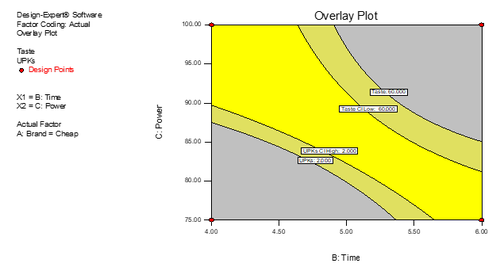
These intervals are displayed numerically under Point Prediction as shown in Figure 1. They can be added as interval bands in graphical optimization, as shown in Figure 2. (Data is taken from our microwave popcorn DOE case, available upon request.) This pictorial representation is great for QbD purposes because it helps focus the experimenter on the region where they are most likely to get consistent production results. The confidence levels (alpha value) and population proportion can be changed under the Edit Preferences option.